
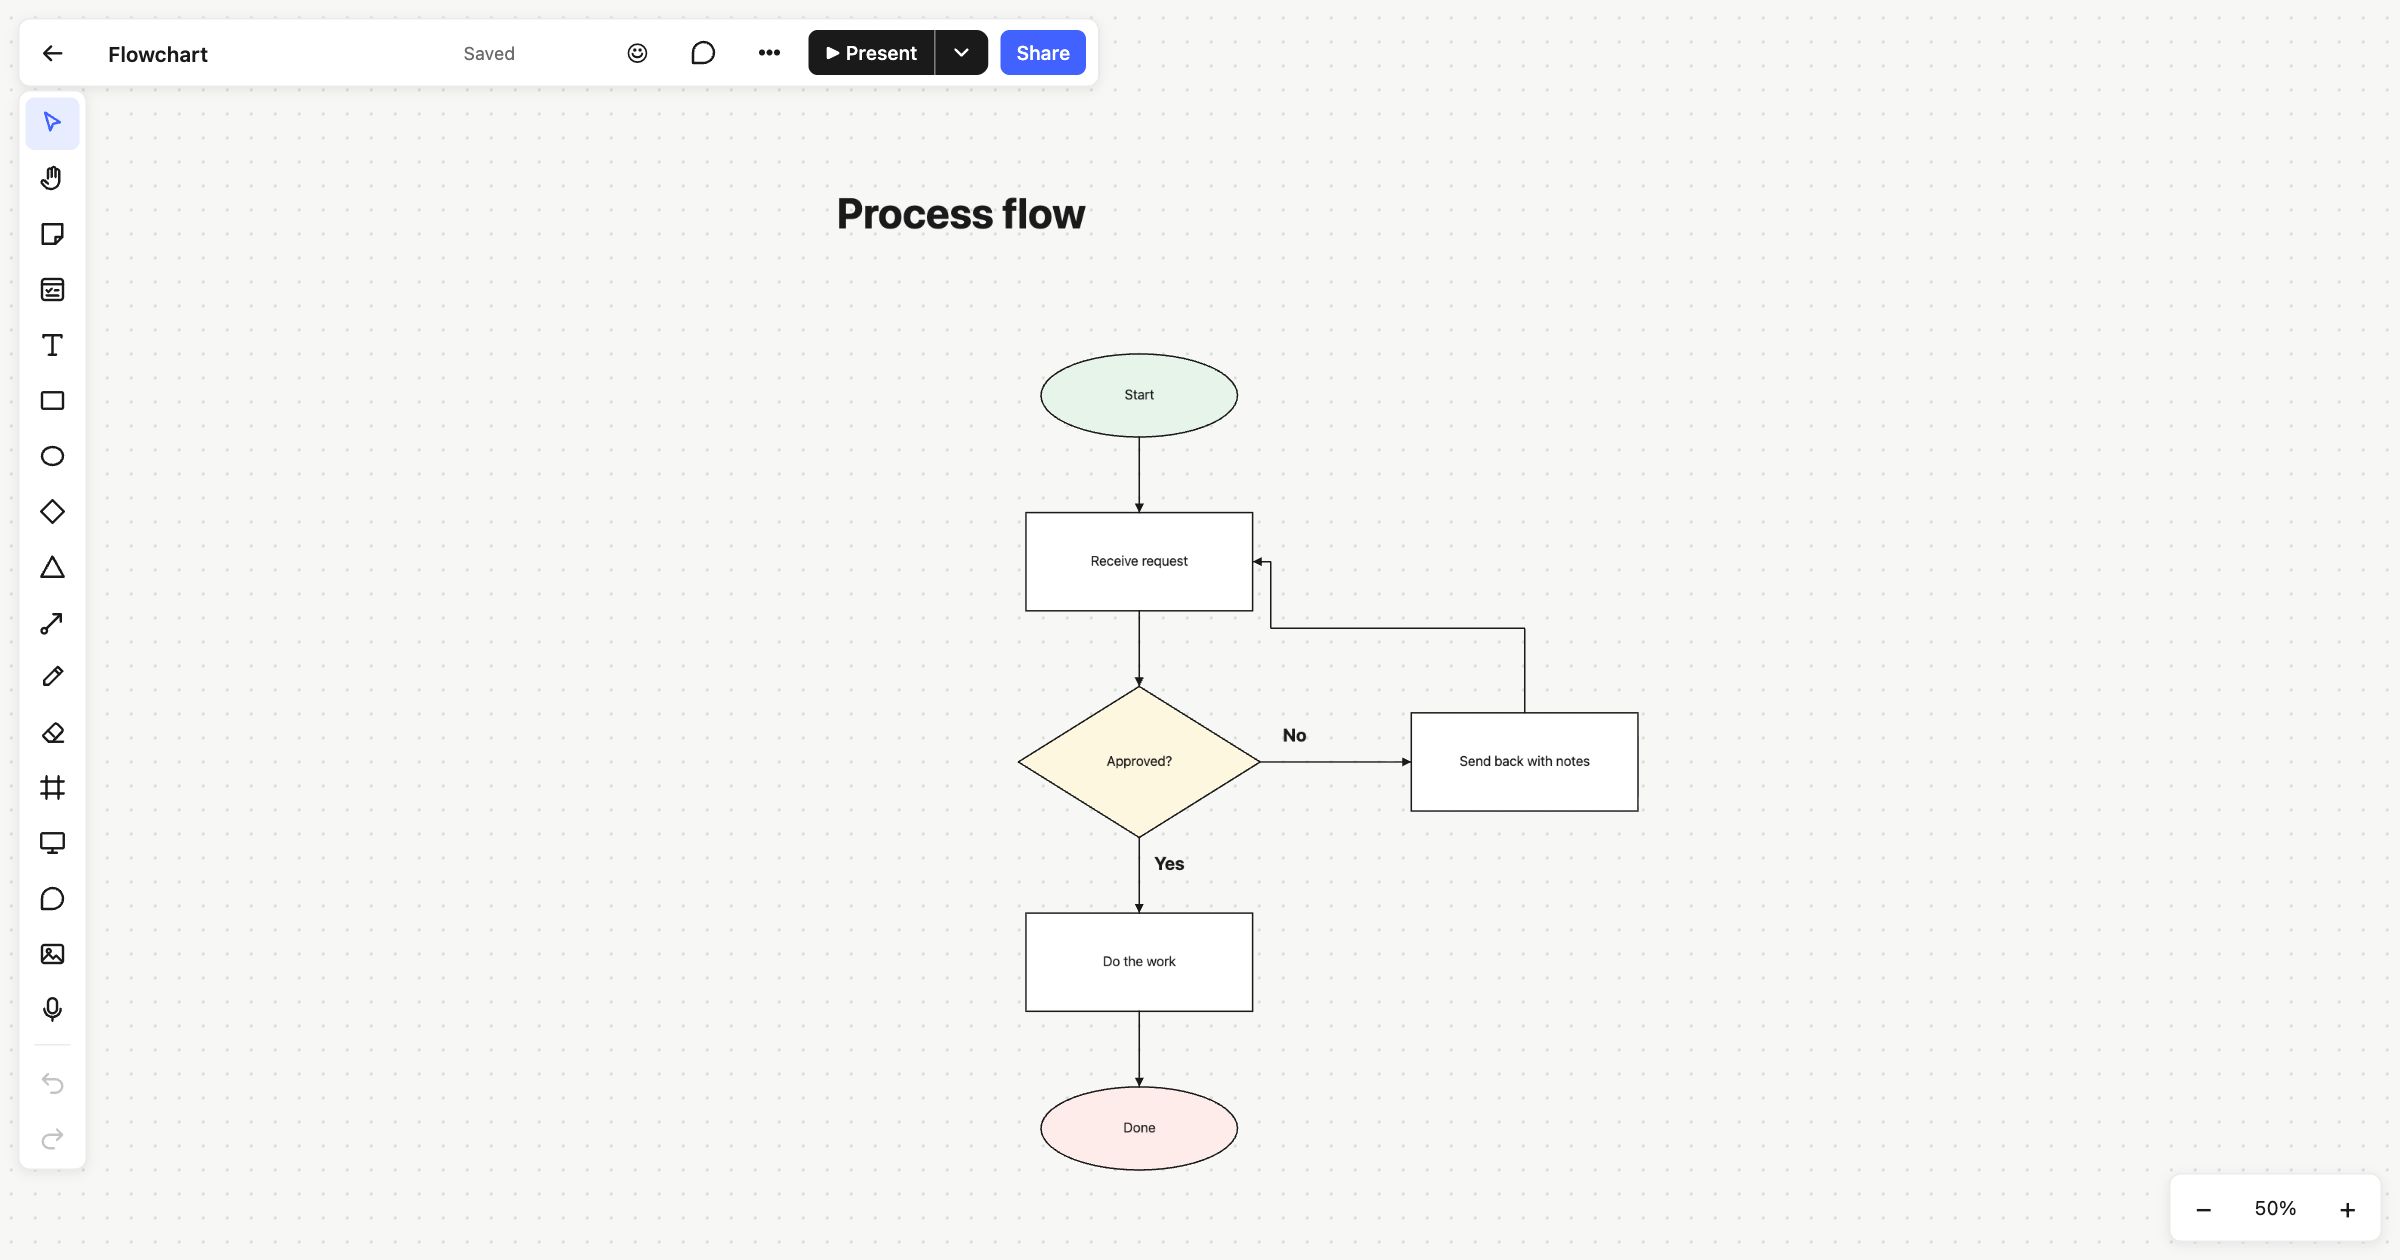
A flowchart shows a process as a series of steps and decisions, joined by arrows. It’s the quickest way to explain how something works, or to find where a process goes wrong. This flowchart template starts you off with a simple approval flow: a start, a request, a yes-or-no decision, a loop back and an end.
When to use a flowchart template
Use a flowchart when you need to agree how a process works: how a request gets approved, how a support ticket is handled, how a user signs up, or what happens when a payment fails. It’s just as useful for spotting problems. Once a process is drawn out, the extra loops, unclear decisions and missing steps are much easier to see.
How to run it
- Pick the start and end. Decide where the process begins and what “done” looks like. Rename the two ellipses.
- List the steps (10 minutes). Add a rectangle for each step, in order. Keep the wording short and start each with a verb.
- Add the decisions. Use a diamond wherever the path splits, and phrase it as a question with a yes or no answer.
- Connect everything. Draw connectors between the shapes, and label each branch out of a decision.
- Walk it through (5–10 minutes). Follow a real example from start to end. If you get stuck, a step or a decision is missing.
What’s on the template
The board is titled “Process flow” and runs from top to bottom:
- A green Start ellipse.
- A Receive request rectangle.
- An Approved? diamond.
- On “Yes”, a Do the work rectangle, then a pink Done ellipse.
- On “No”, a Send back with notes rectangle, with an arrow looping back to “Receive request”.
All the arrows are connectors attached to the shapes, so when you move a shape its arrows move with it. The loop back uses an elbow connector, which turns in right angles rather than cutting across the chart.
Building your flowchart
The toolbar has the shapes a flowchart needs: rectangles, ellipses, diamonds and triangles. Connectors can be straight or elbow, with or without arrowheads, and attach to the sides of a shape. To keep a large chart tidy:
- Align and distribute. Select a column of shapes and line them up by their centres, or space them evenly.
- Group a section with ⌘G so it moves as one.
- Lock anything you don’t want nudged by accident, such as a title or a background frame.
When it’s finished, export it as PNG, SVG or PDF for a document, or publish the board for a live, read-only link.
Read more about connectors. For a page-by-page view of a website, try the website sitemap template. To see the whole experience rather than one process, use the customer journey map or the user story map.
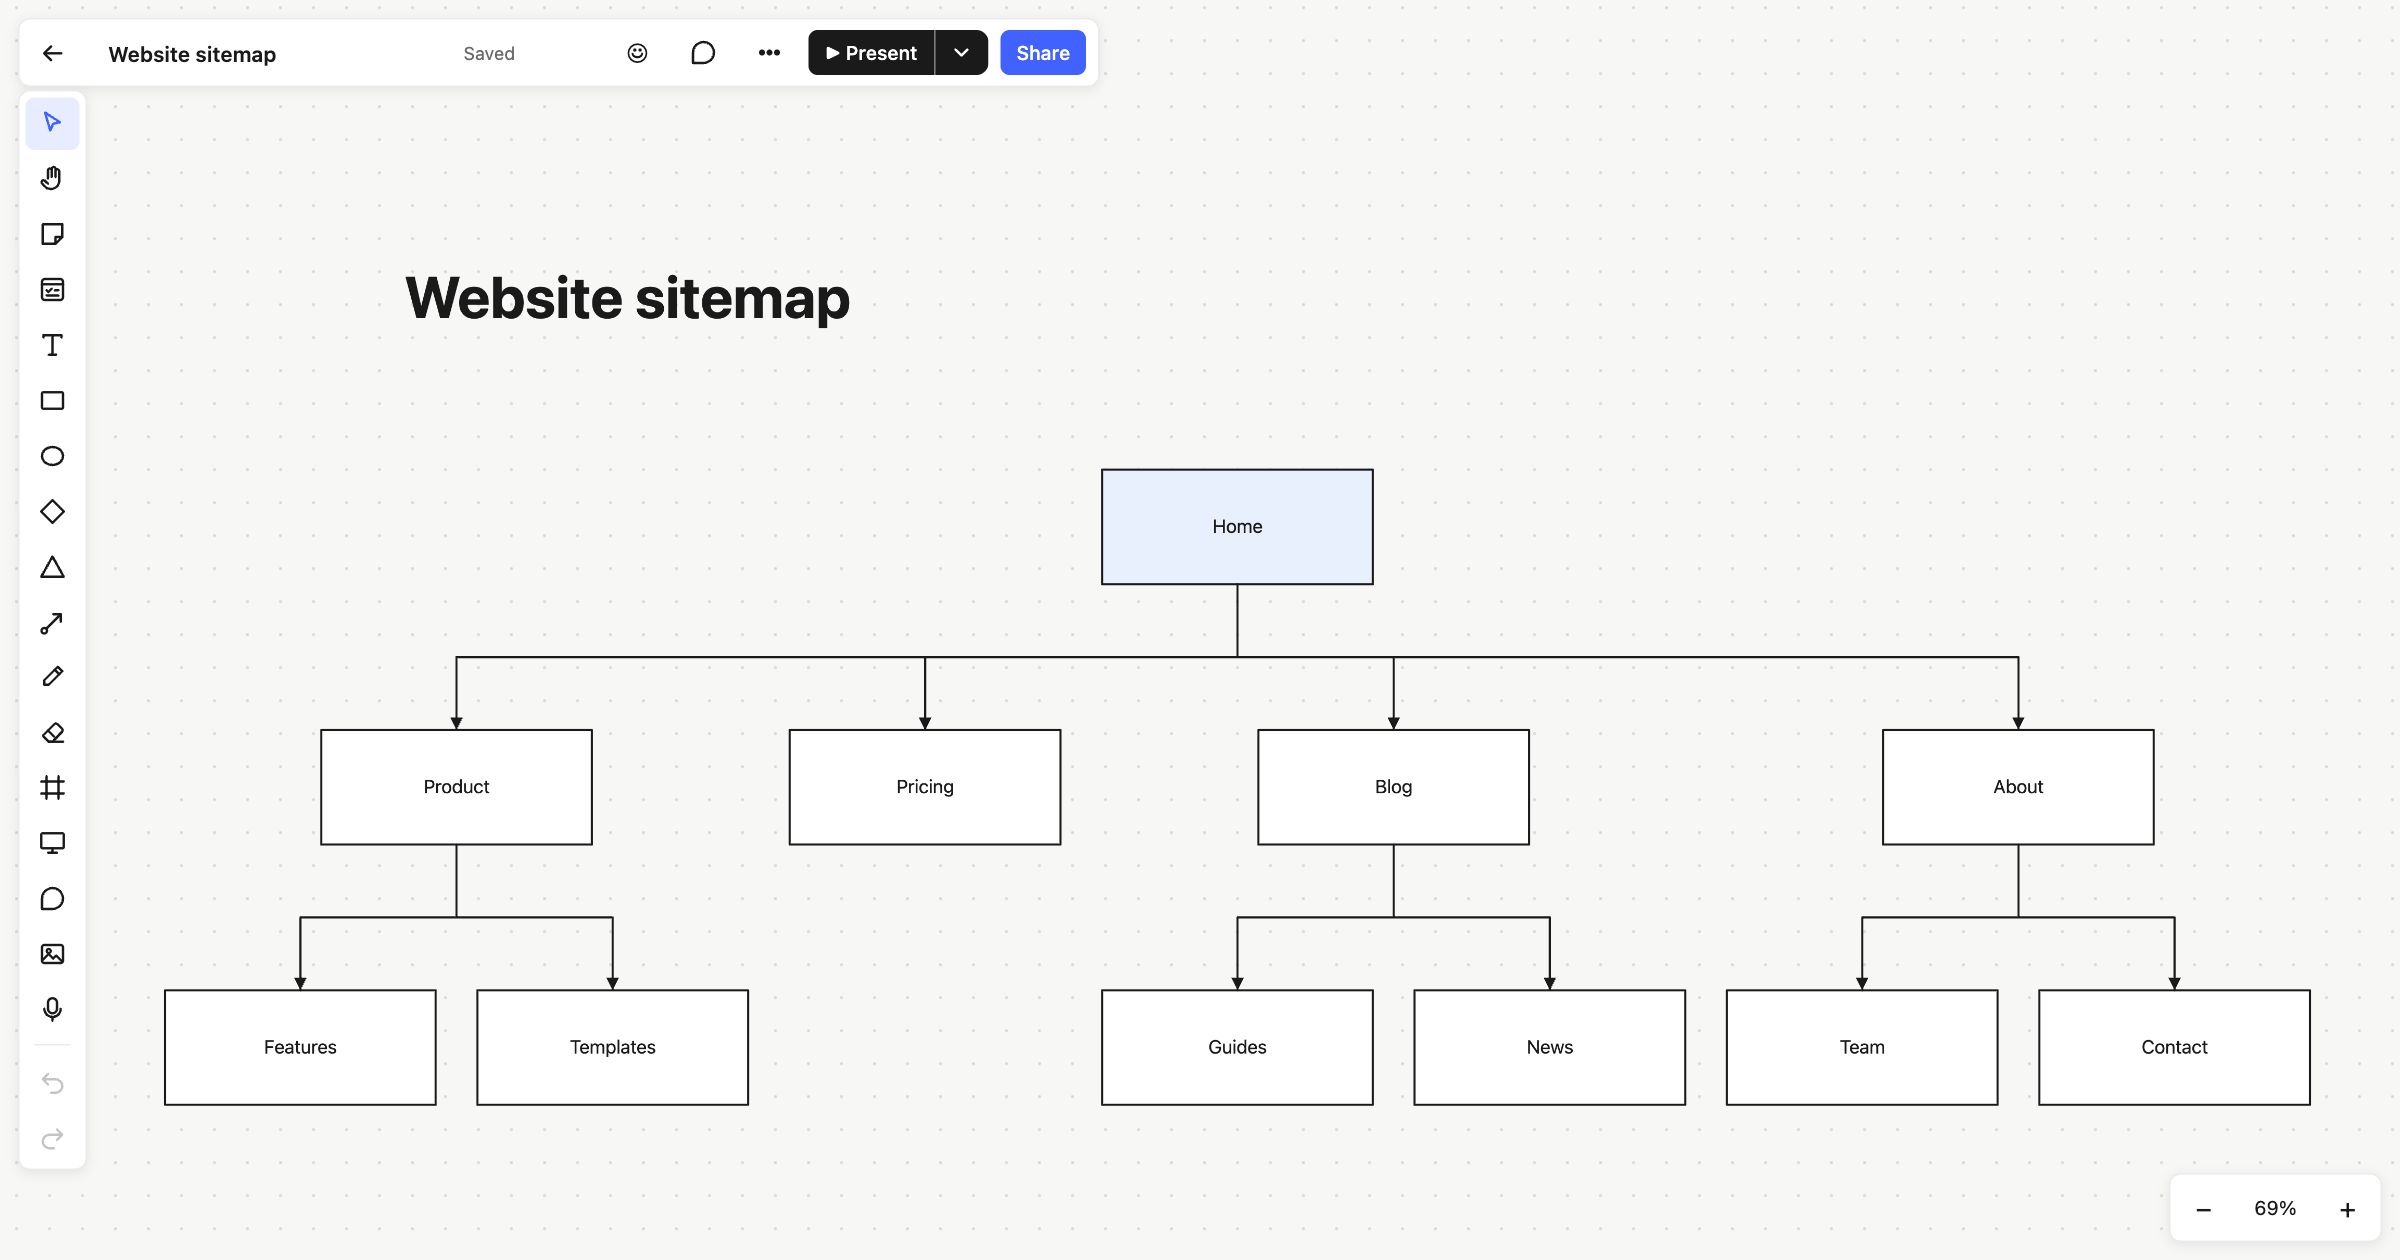 Website sitemap
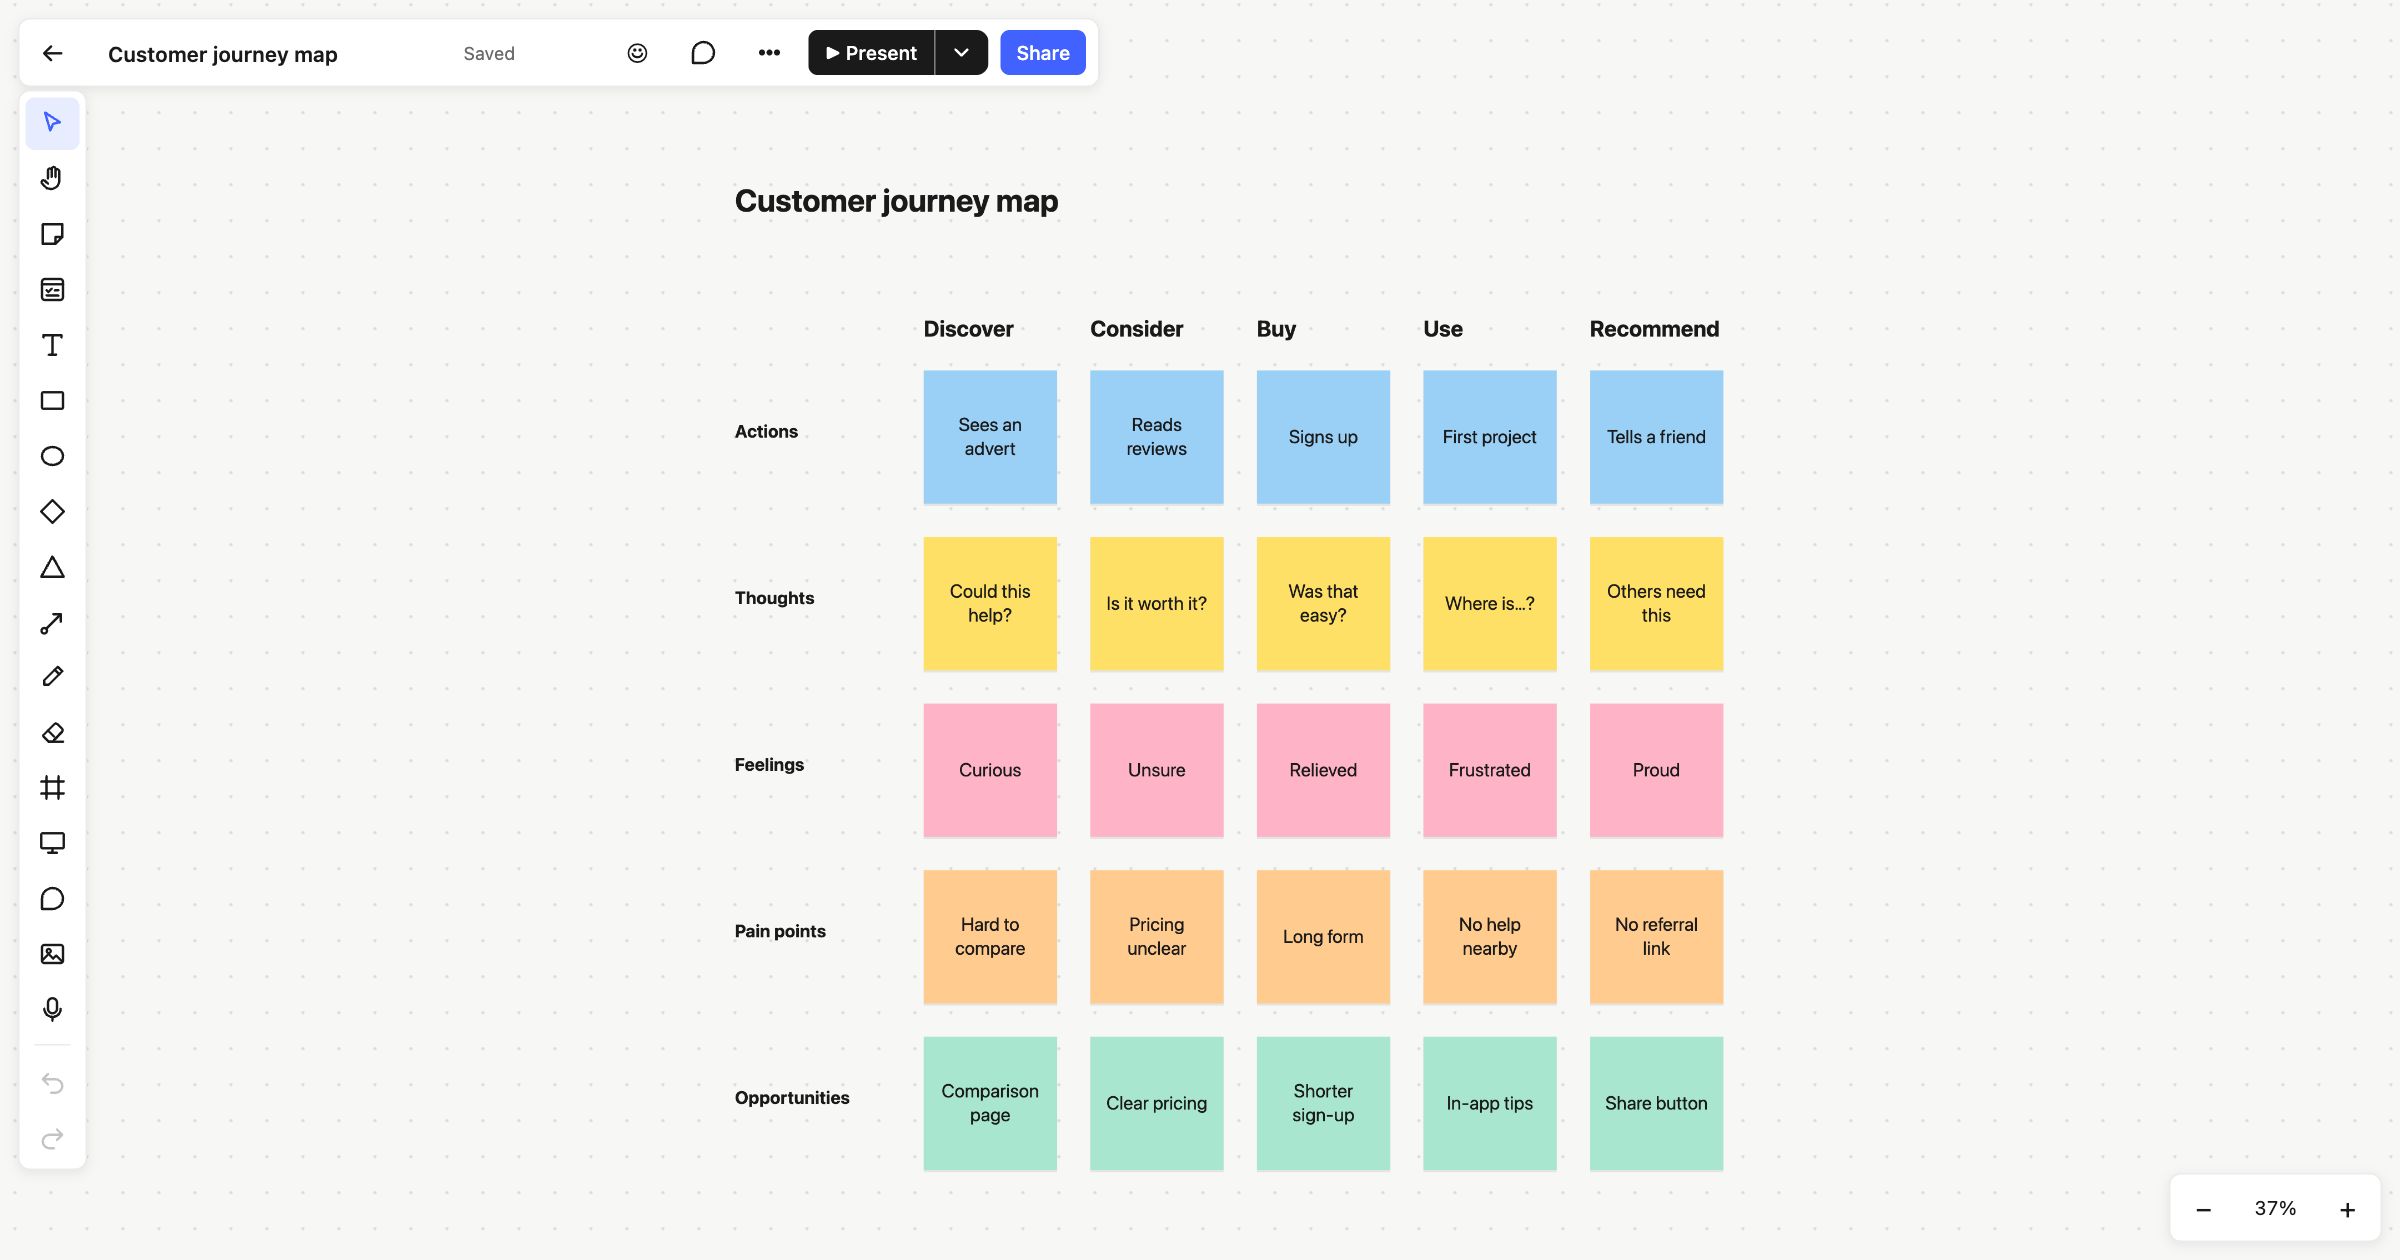 Customer journey map
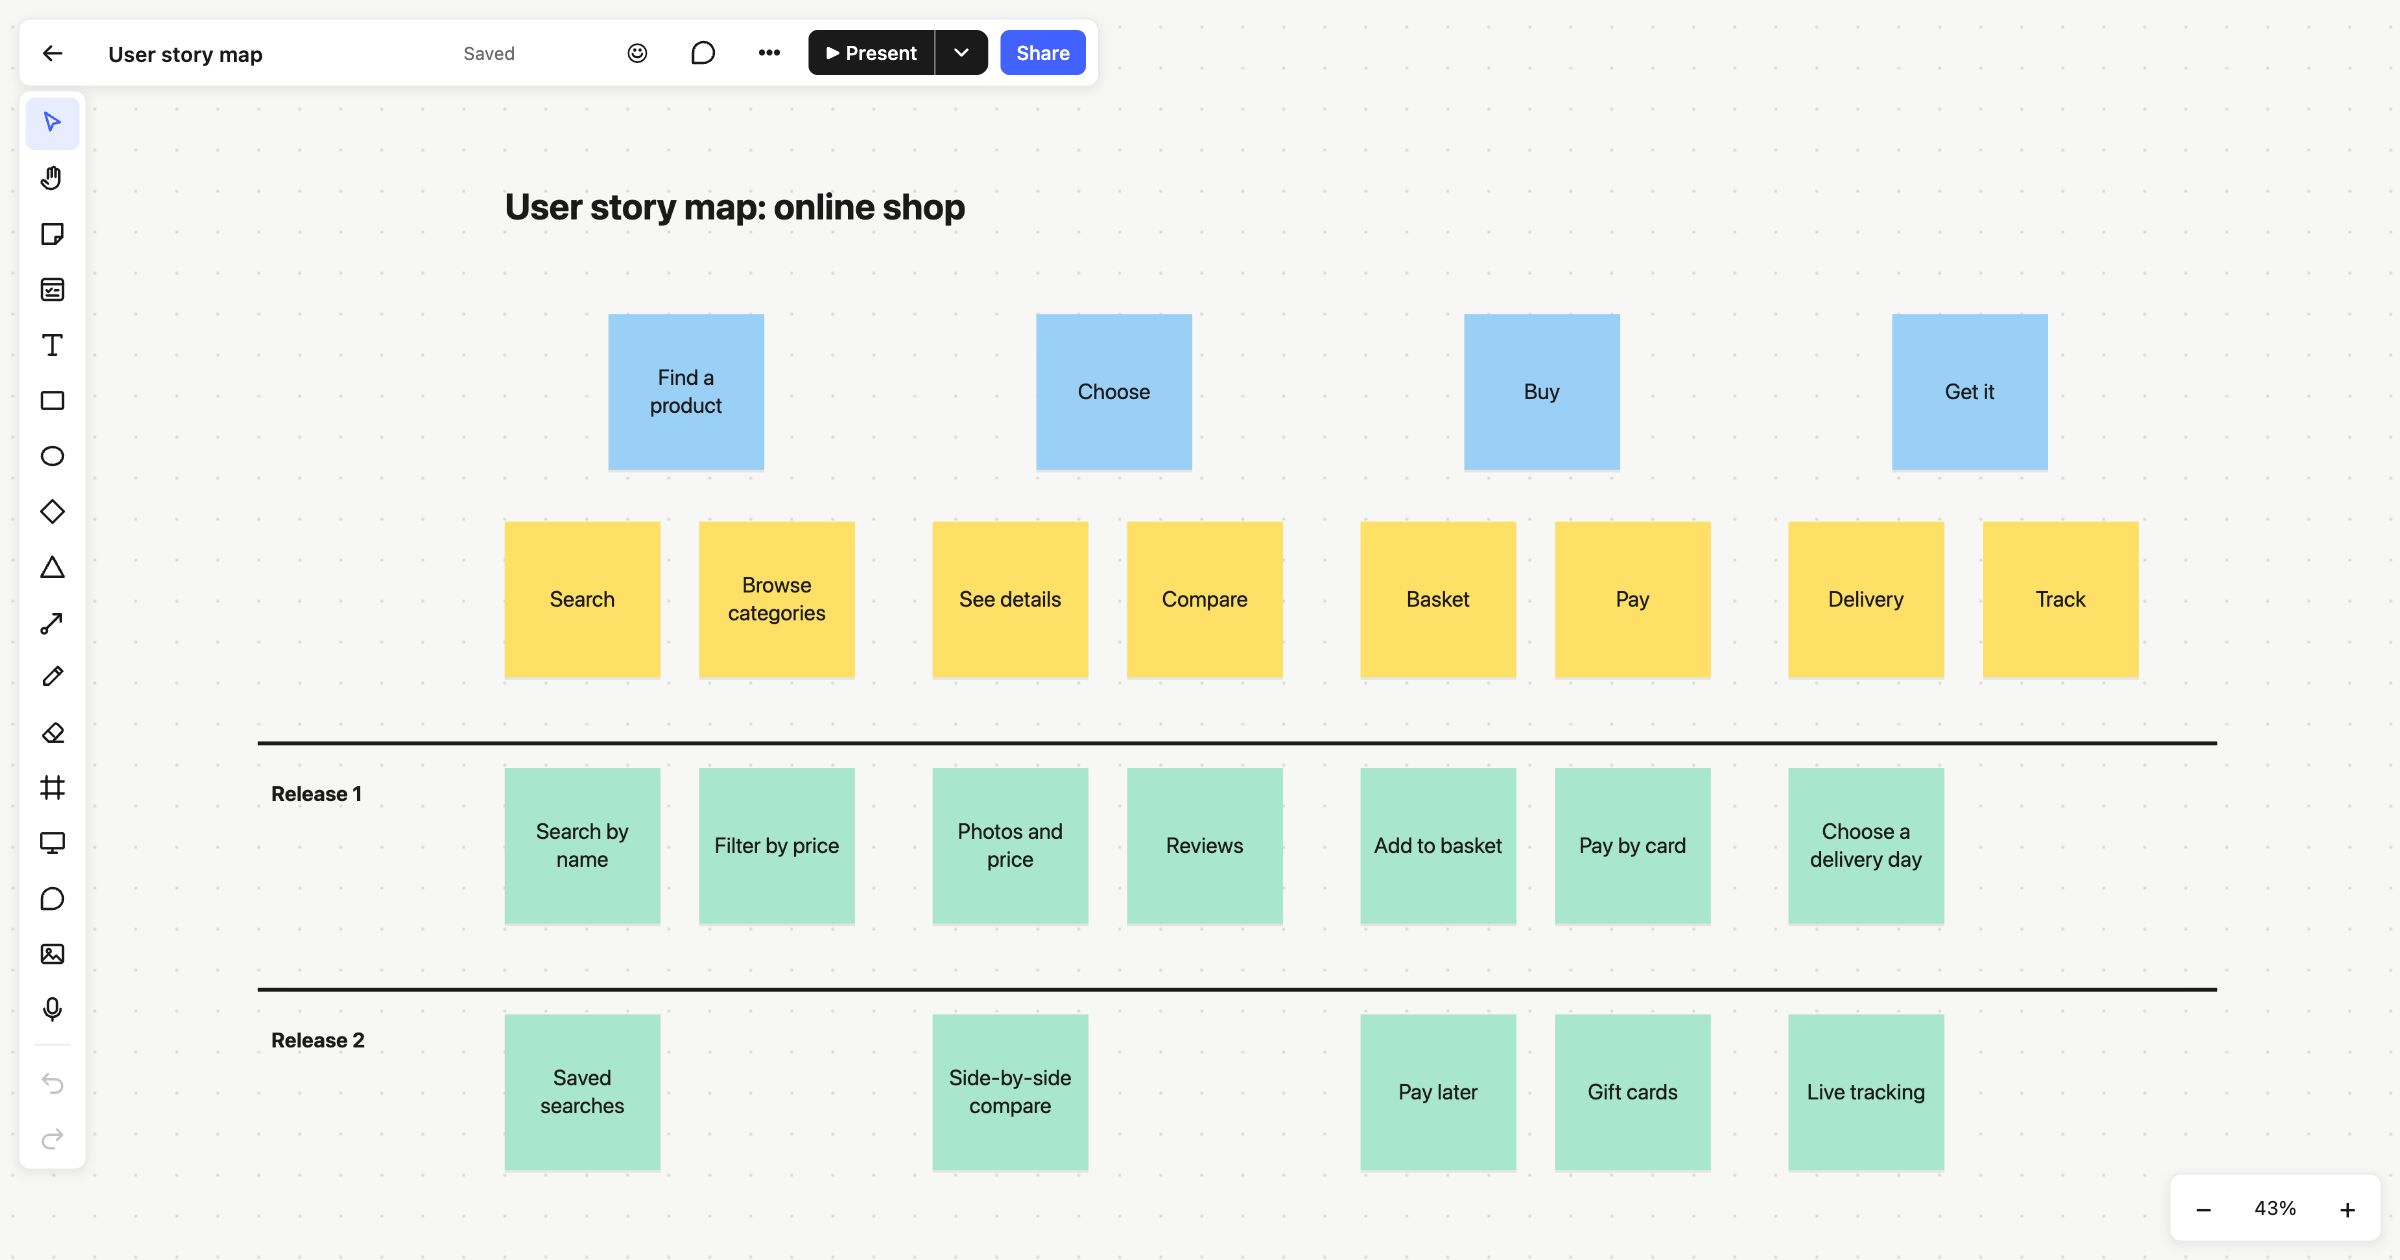 User story map