
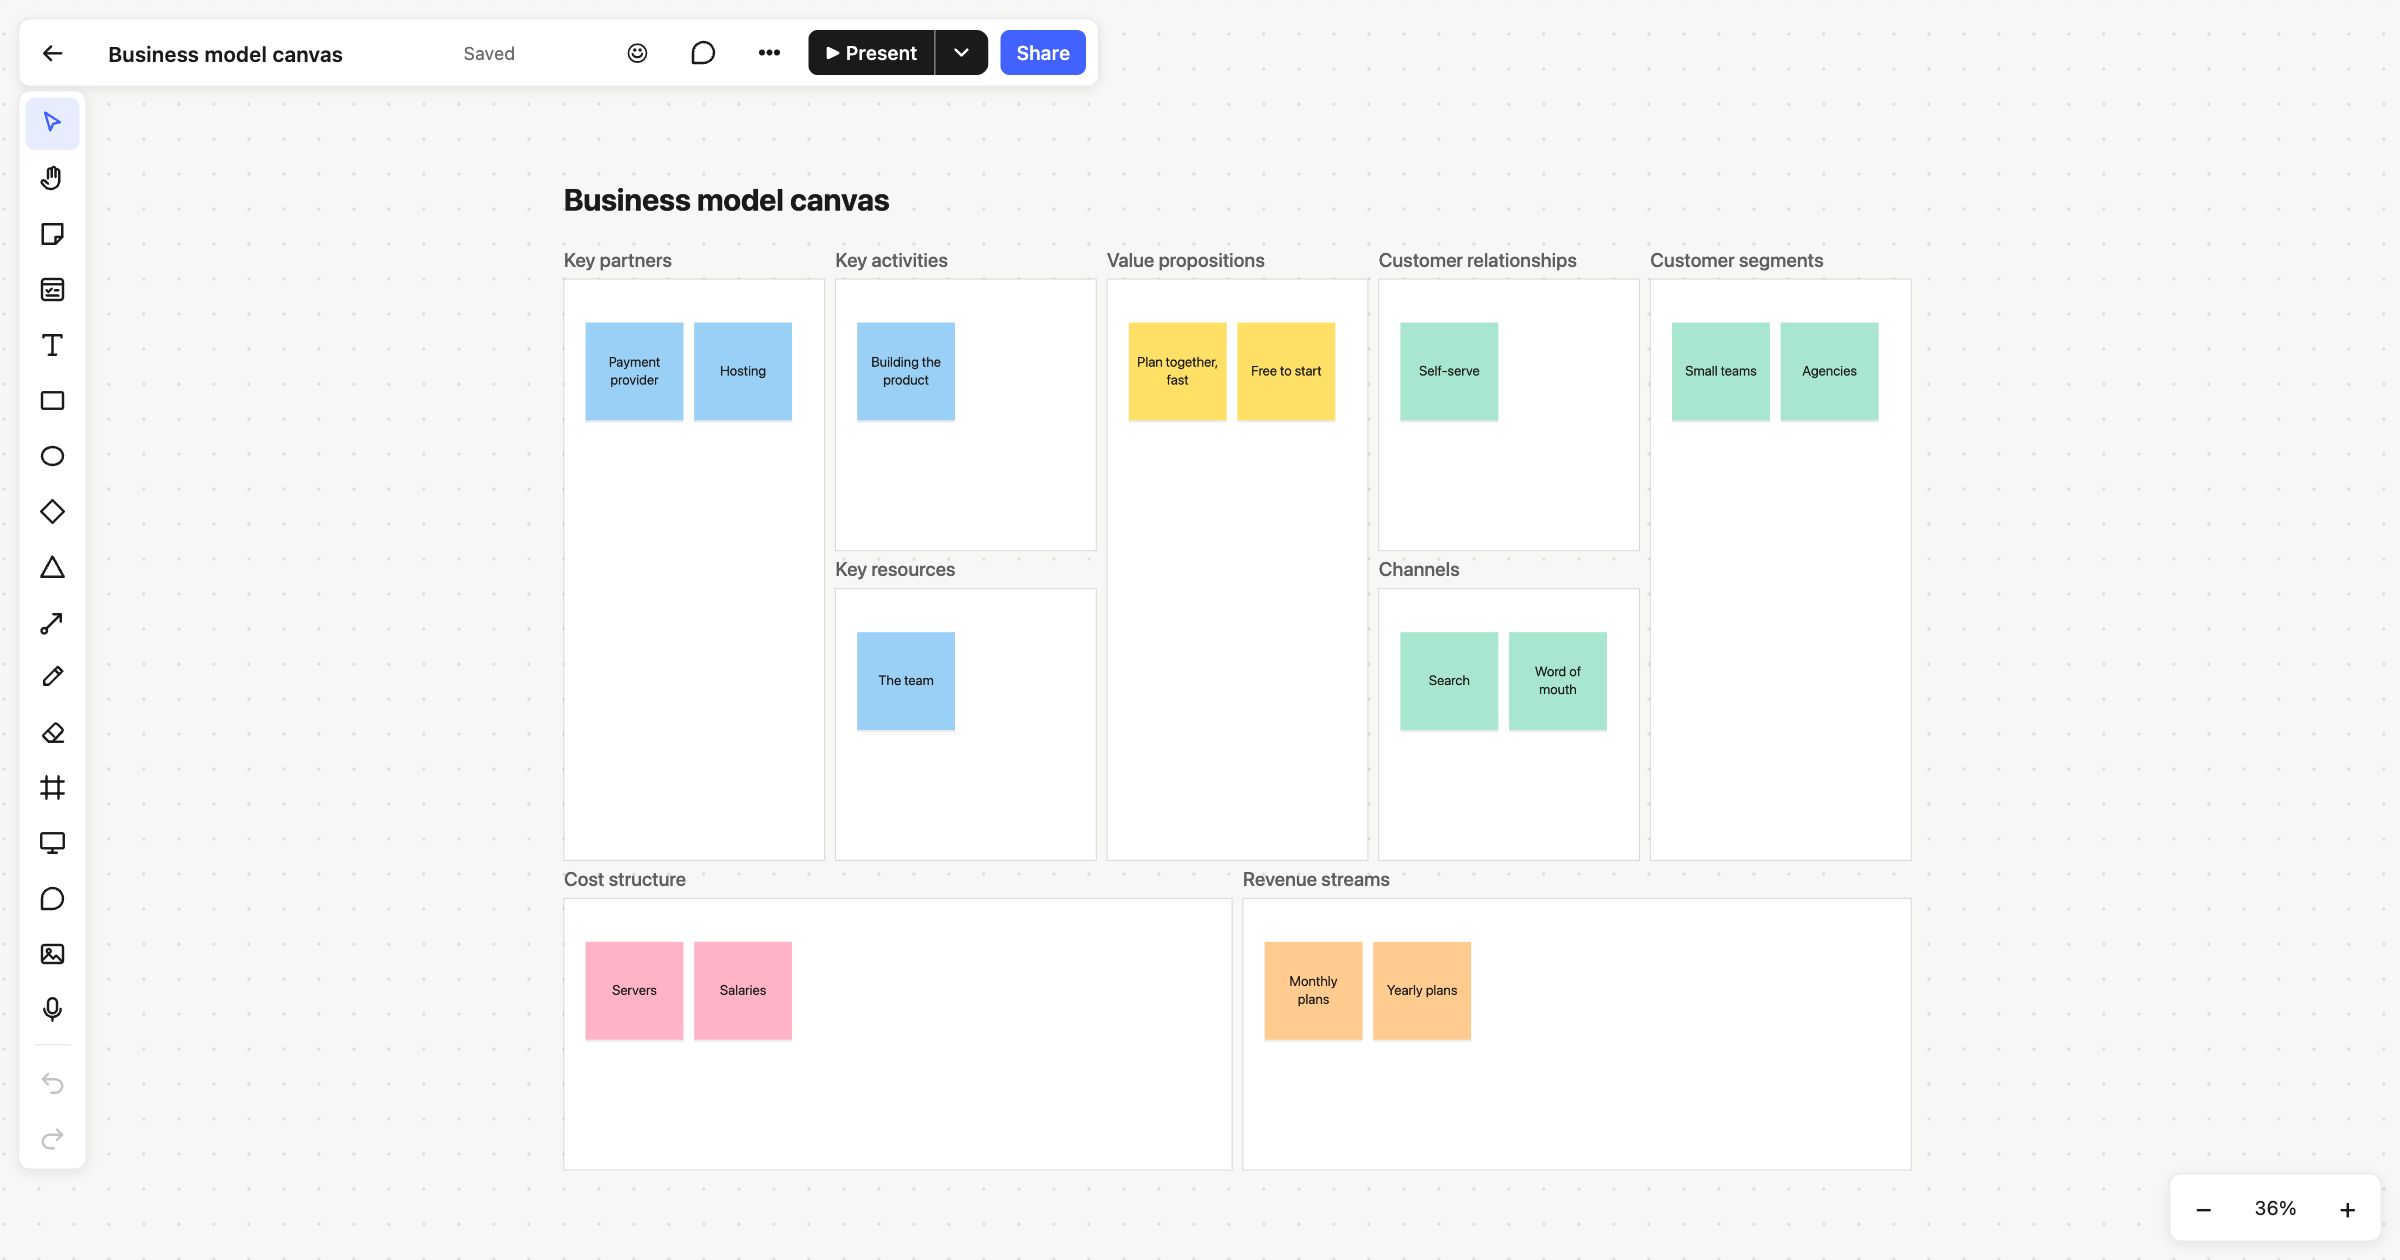
The business model canvas lays out how a business works on a single page. It splits the business into nine building blocks, from who your customers are to where the money comes from and goes. Because it fits on one board, you can see how a change in one block affects the others. This business model canvas template is for founders, product teams and students who want to test an idea, explain an existing business or compare a few options side by side.
When to use a business model canvas
- When you’re shaping a new business or product, before writing a long plan.
- To explain an existing business to a new team member, partner or investor.
- When considering a change, such as a new customer group or pricing model.
- To compare options: make a second canvas and change one block at a time.
How to run it
Work through the blocks roughly in this order, spending five to ten minutes on each. Use one sticky note per point.
- Customer segments. Who are you creating value for?
- Value propositions. What problem do you solve for each segment?
- Channels. How do they hear about you and buy?
- Customer relationships. How do you keep in touch with them?
- Revenue streams. What do they pay for, and how?
- Key resources. What do you need to deliver all this?
- Key activities. What do you need to do well?
- Key partners. Who helps you do it?
- Cost structure. What are the biggest costs?
Then step back for ten minutes. Read the canvas from right to left, and check every value proposition has a segment, a channel and a way to make money.
What’s on the template
The board is titled “Business model canvas” and follows the classic layout. Across the top are five columns: Key partners, Key activities above Key resources, Value propositions, Customer relationships above Channels, and Customer segments. Below them, Cost structure and Revenue streams share the bottom row.
Each block is a frame with one or two example sticky notes for an imaginary software company, such as “Payment provider”, “Free to start”, “Small teams” and “Monthly plans”. The notes are colour-coded by area: blue for the partner side, yellow for value, green for customers, pink for costs and peach for revenue.
Tips
- Mark your assumptions. Pin a comment to any note you haven’t tested yet, so the team knows what to check.
- Present it block by block. Present the board and press → to step through its frames, with everyone on the board following your view.
- Export it. Export as PDF, PNG or SVG when you need it in a document or slide.
For a startup at an earlier stage, the lean canvas focuses on problems and metrics. Pair either with a SWOT analysis, or map the experience with a customer journey map.
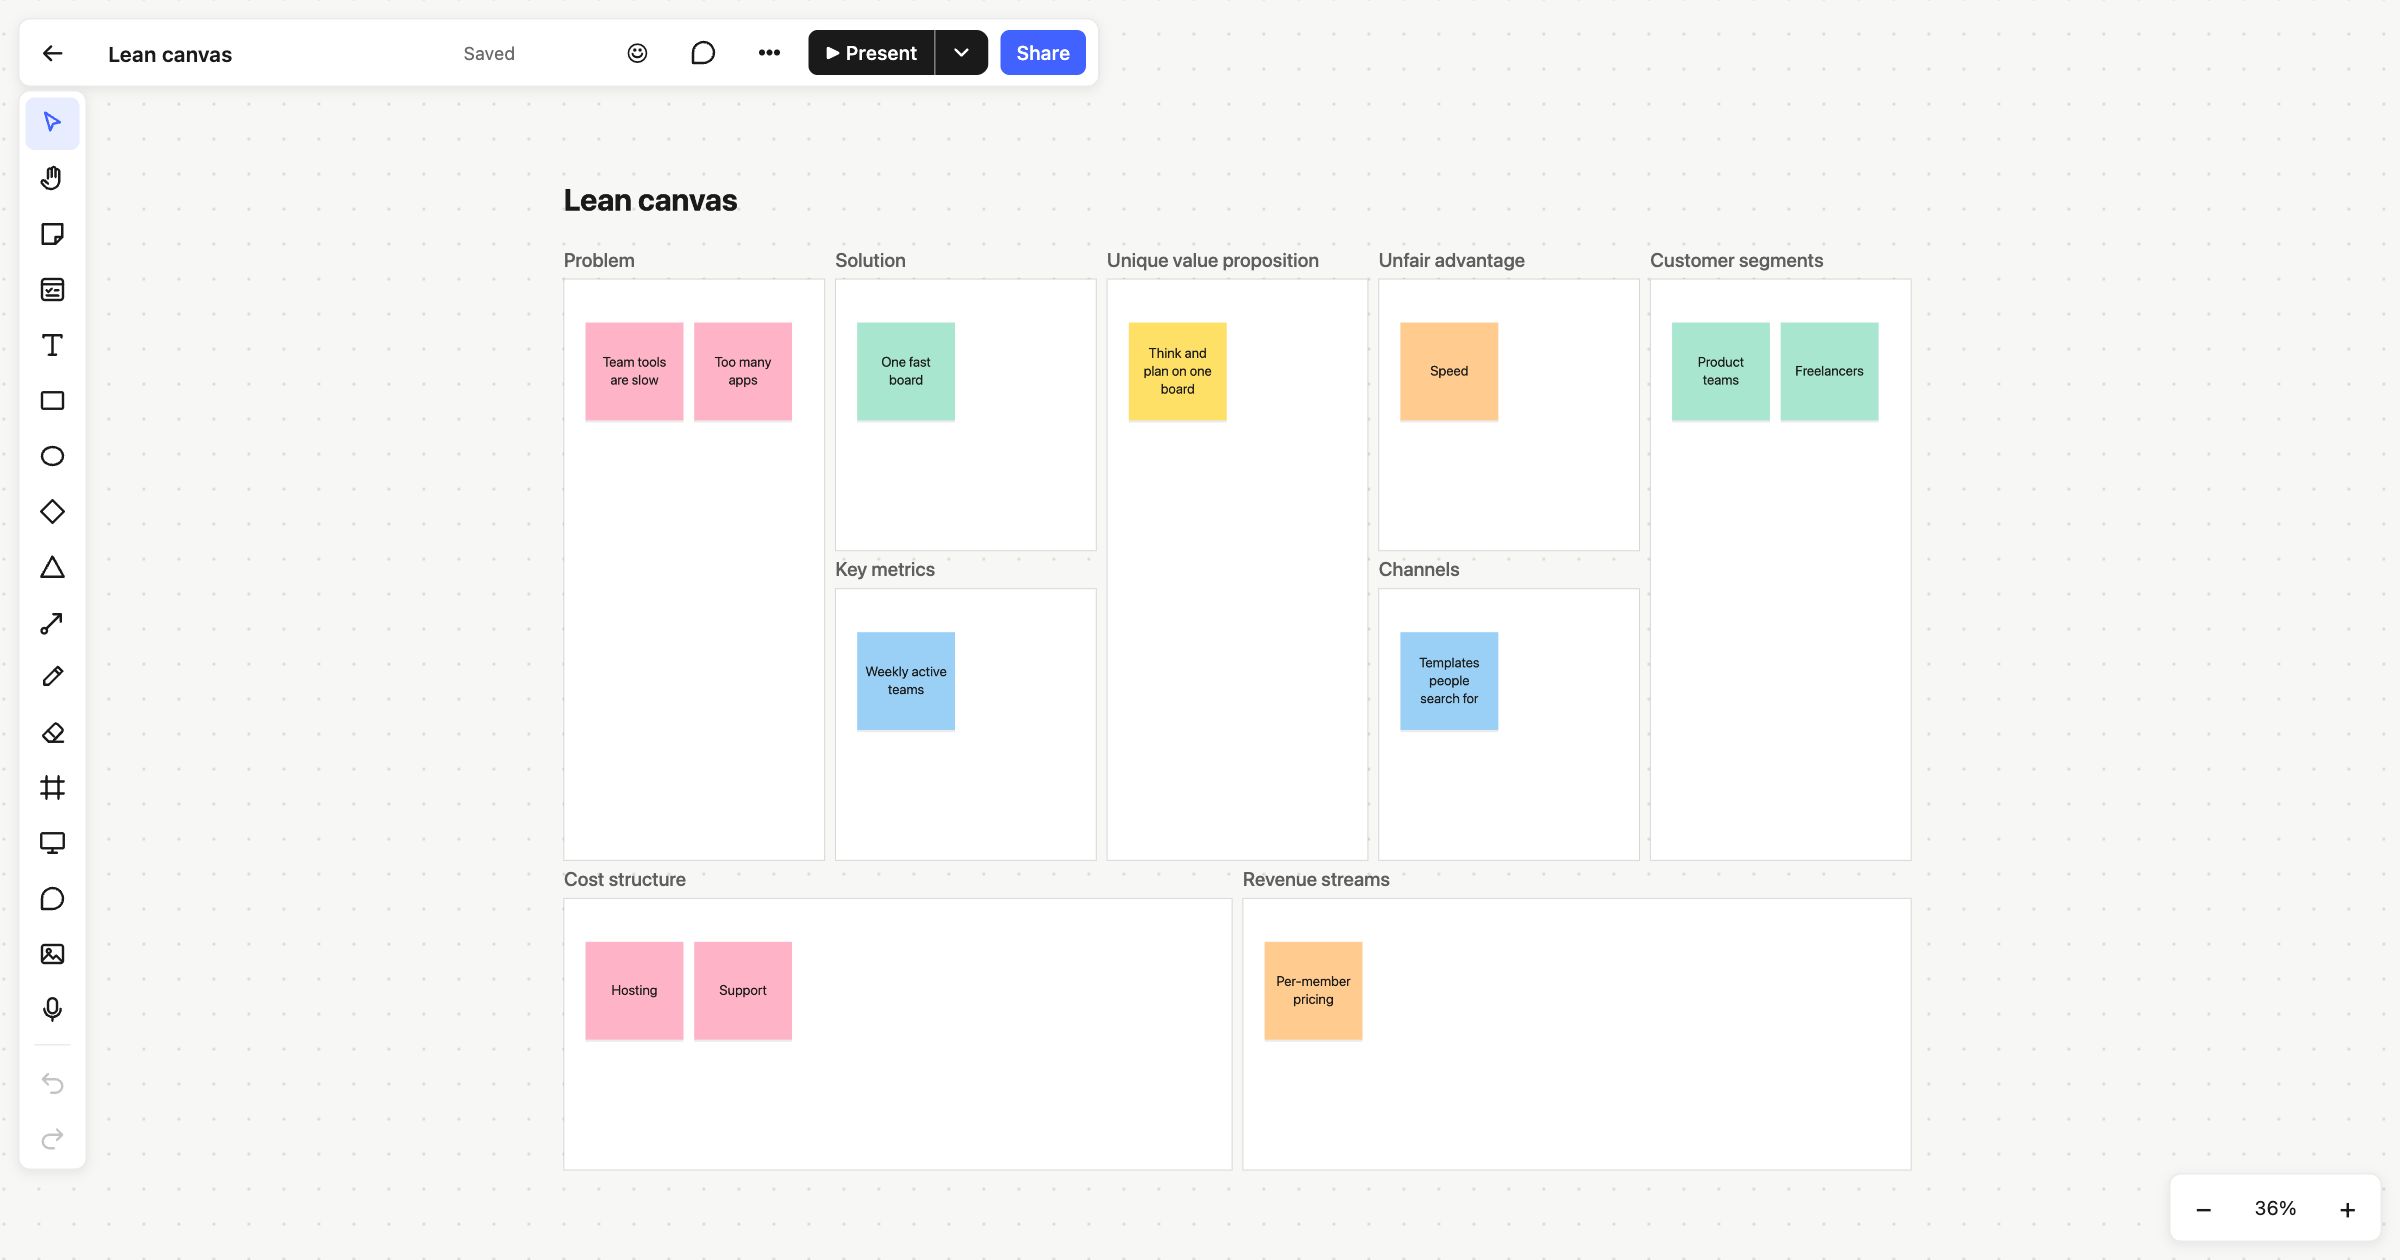 Lean canvas
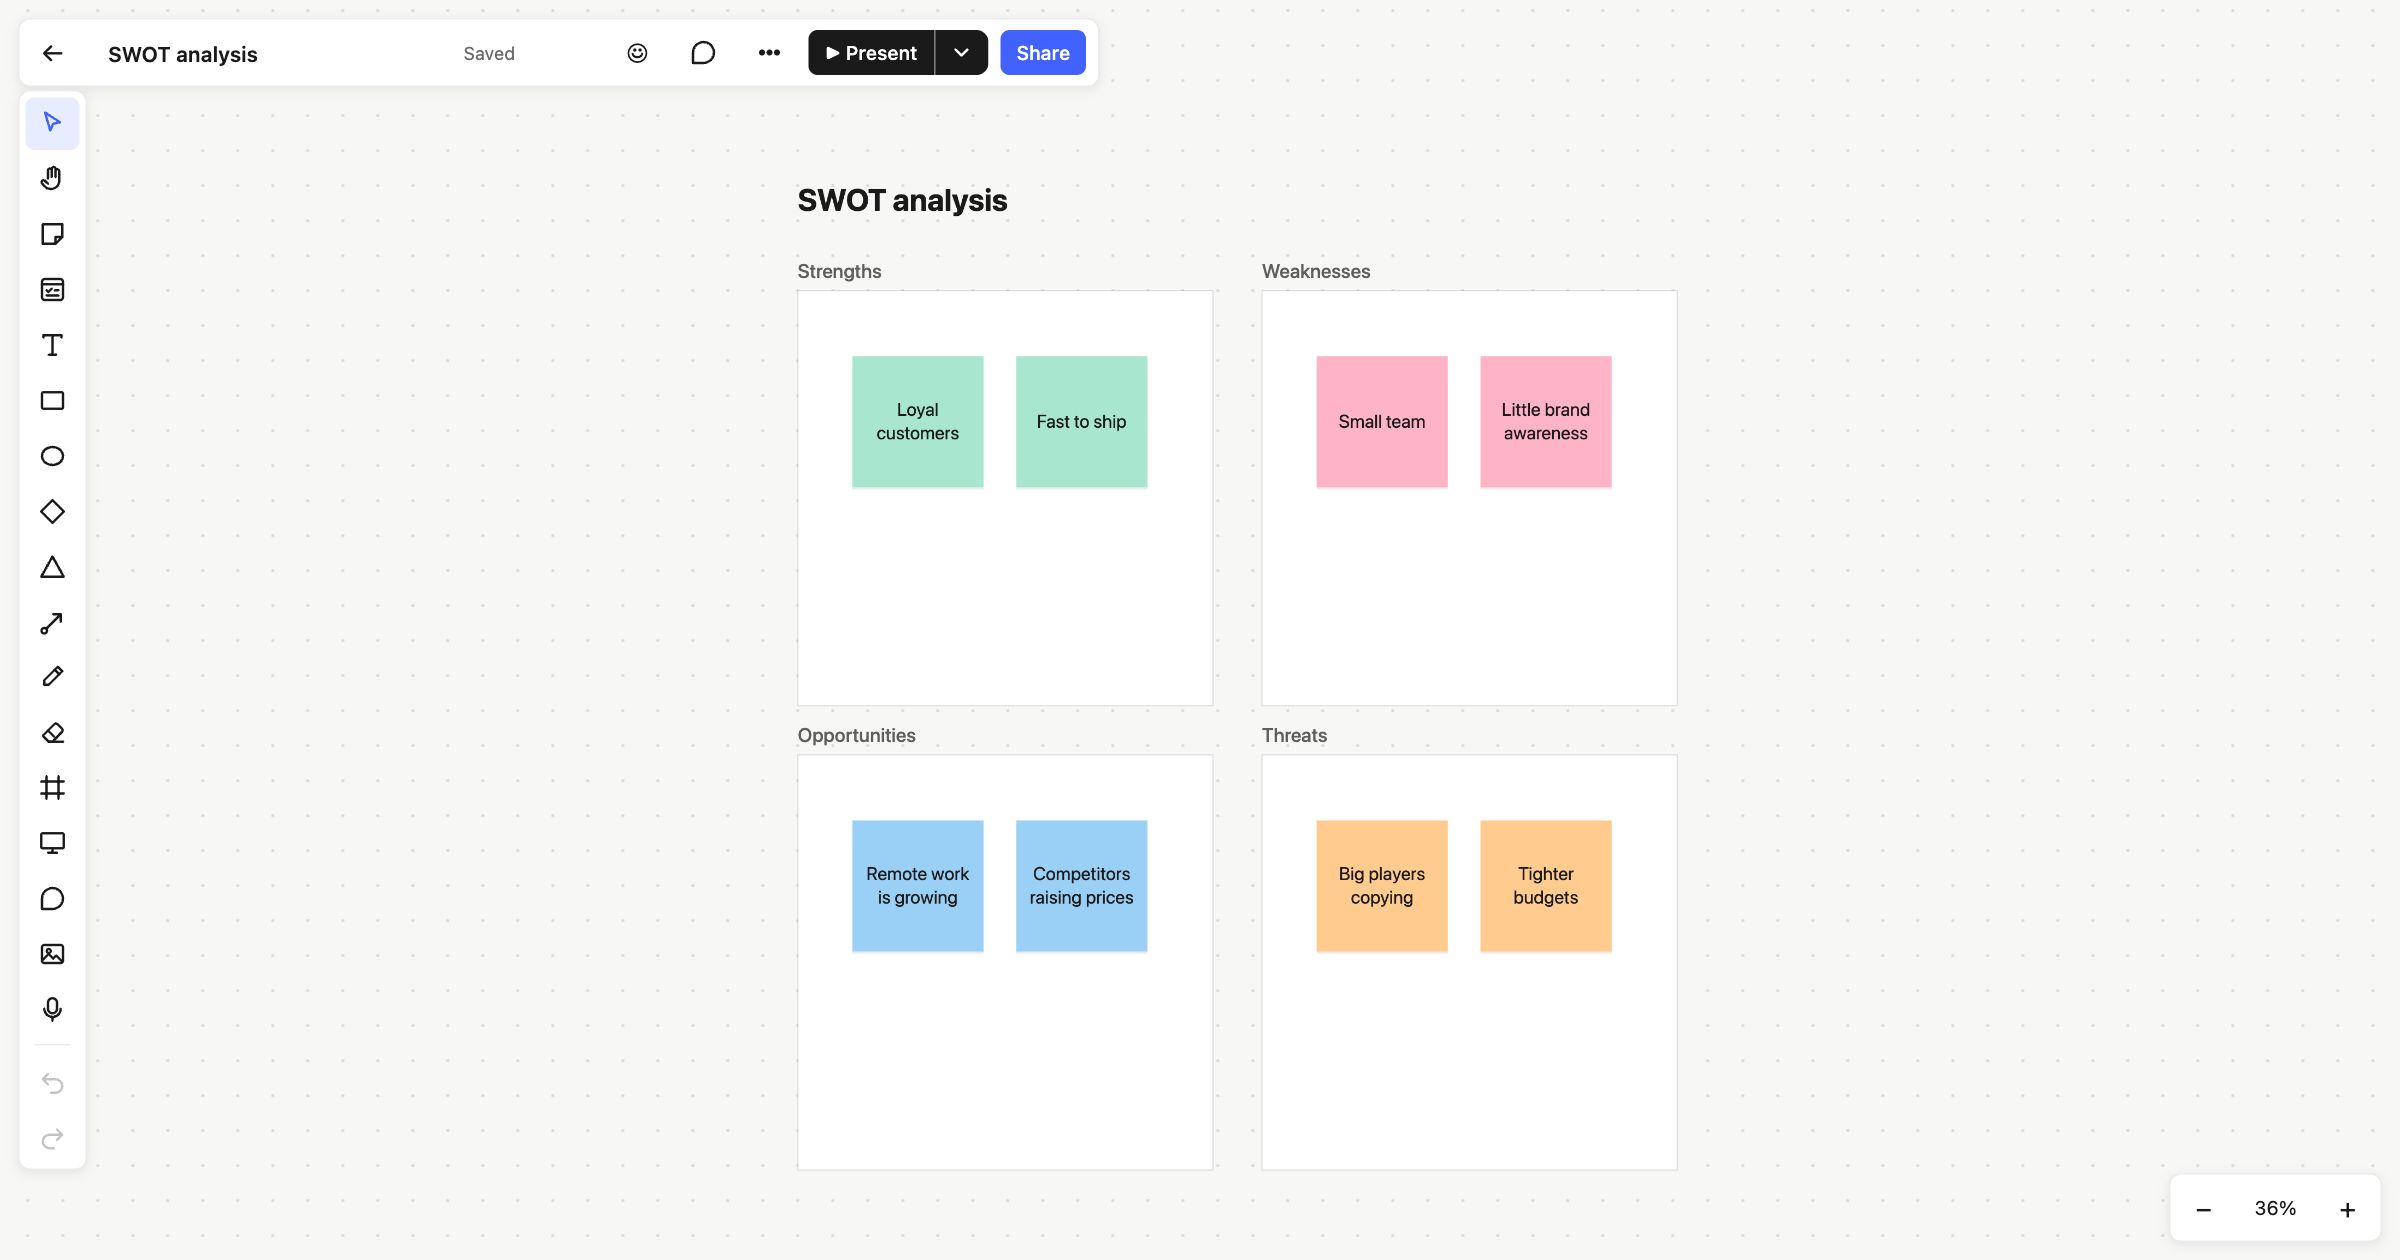 SWOT analysis
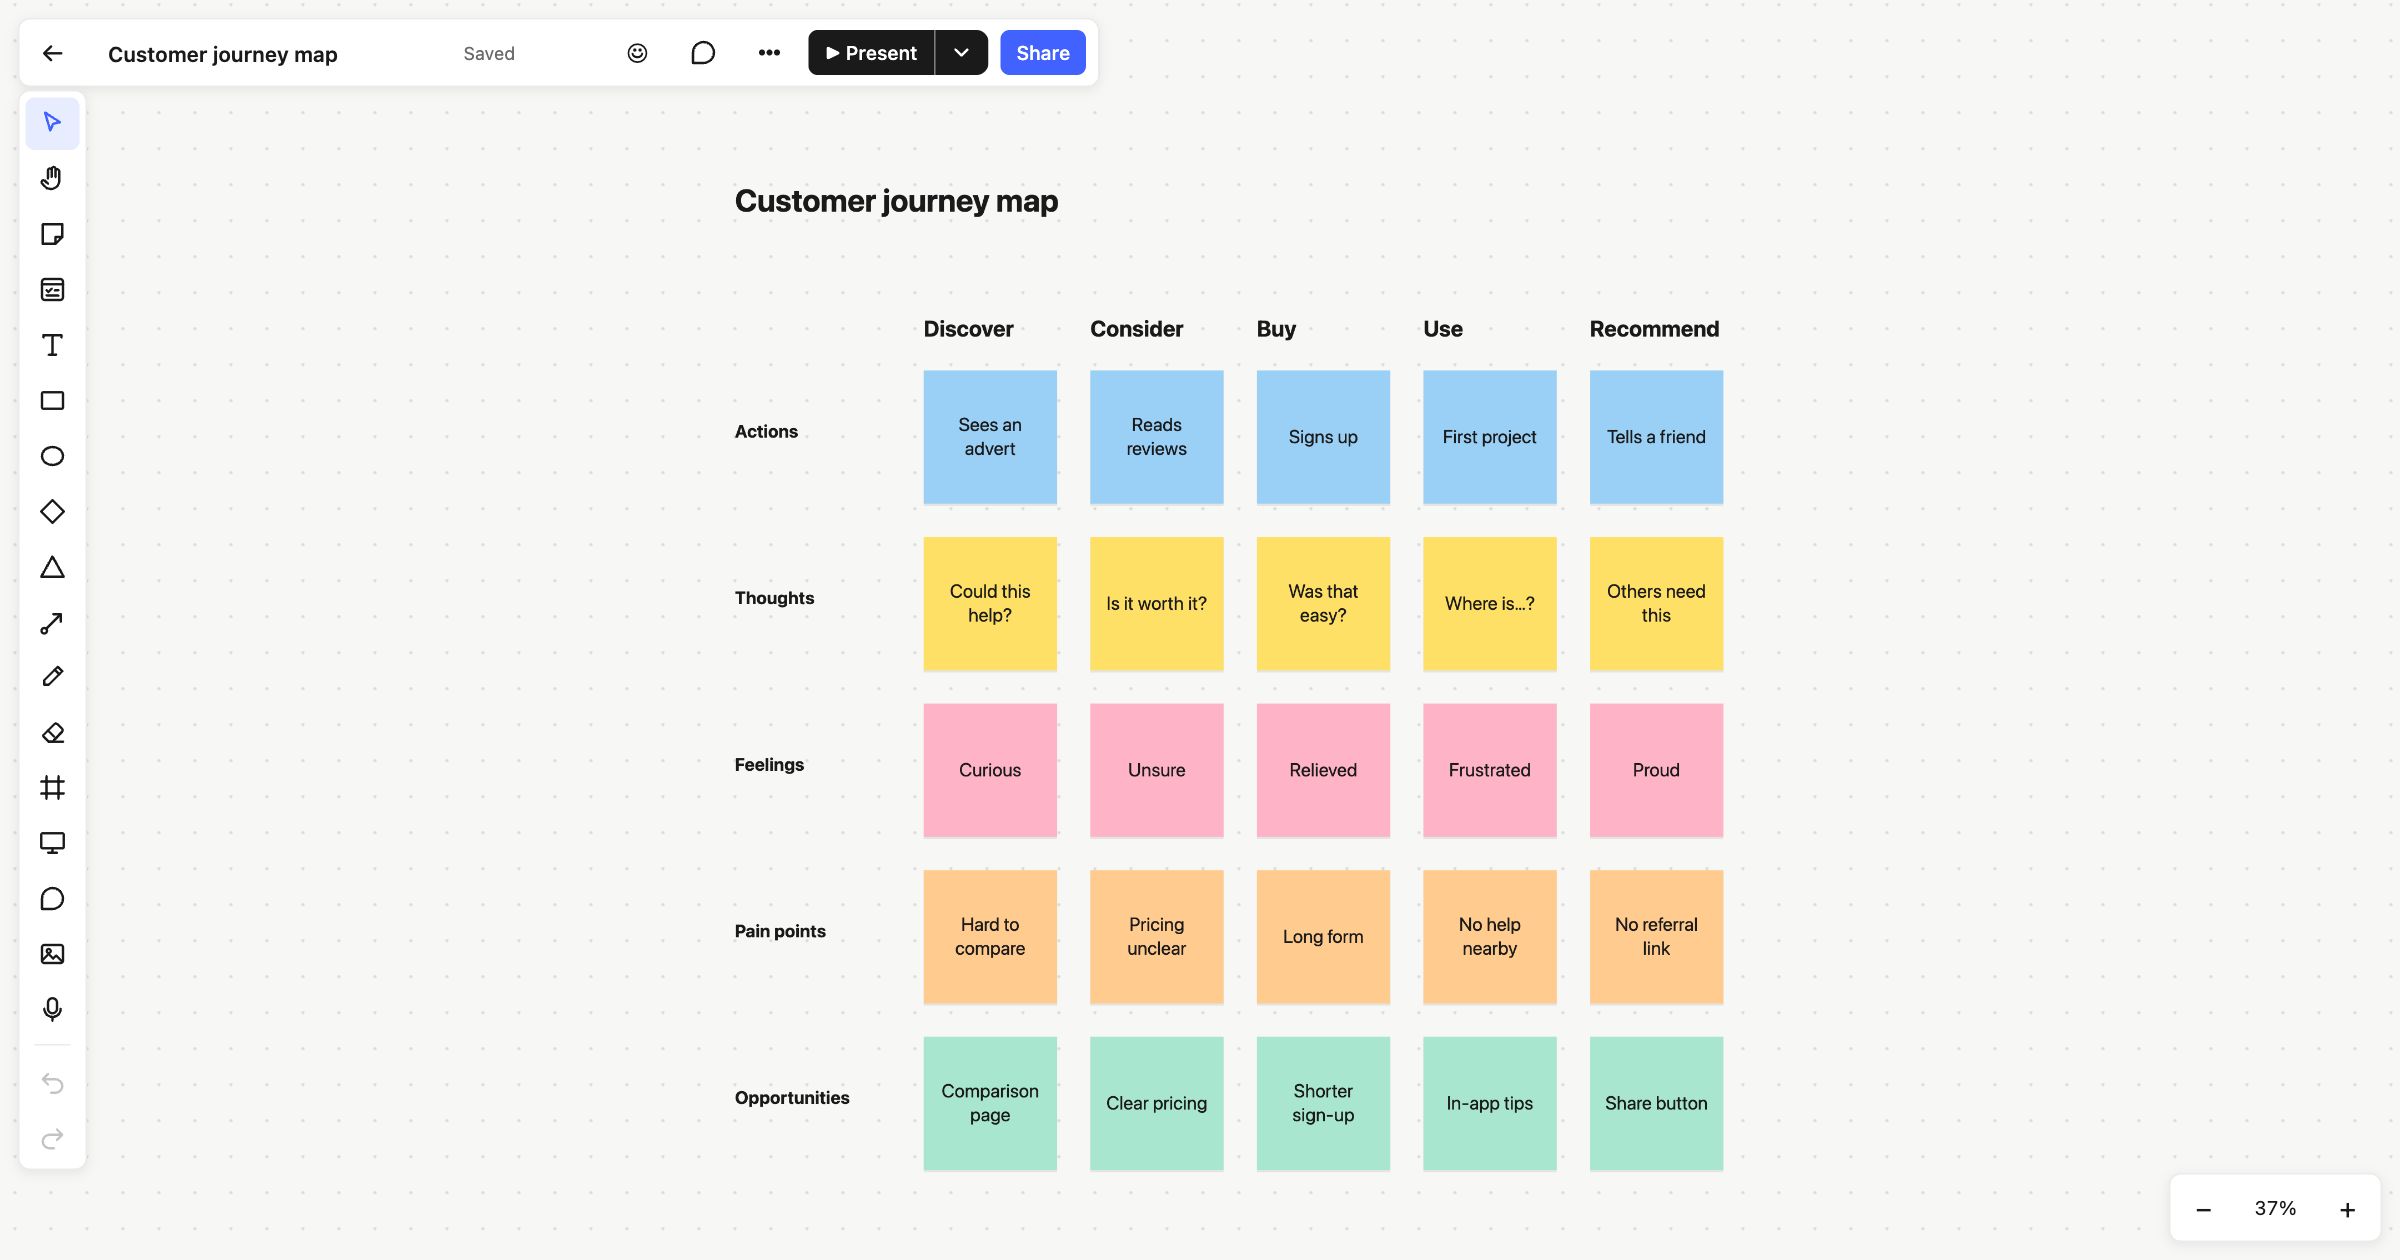 Customer journey map